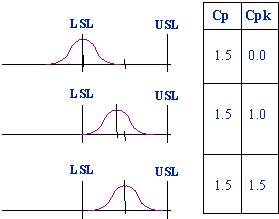
In IFS/Quality Management – Capability Indices, you can:
A process is in statistical control (“in control”) when all special causes of variation have been eliminated and only common causes remain, i.e., observed variation can be attributed to a constant system of chance causes. Since a process in statistical control can be described by a predictable distribution, it is possible to estimate the proportion of parts that are within specification limits. Capability can be described as the natural fluctuation of a key characteristic or process compared to the engineering specifications. Capability literally means "capability to meet a specification."
The two most commonly used Capability Indices are Cp and Cpk:
![]()
![]()
Where USL = Upper Specification Limit, LSL = Lower Specification Limit and
![]() n
= number of measurements xi = measurement data i
n
= number of measurements xi = measurement data i
Cpk takes into account whether the process is centered or not. This is not
the case
with Cp.

If the process is perfectly centered then Cpk = Cp, otherwise Cpk < Cp.
The table below shows the relation between various capability values and the corresponding number of nonconformities (defective rate).
Typical capability requirements are Cpk and Cp values > 1.33
Cp Value |
Defective Rate |
| 0.50 | 133,600 parts per million (ppm) |
| 0.75 | 24,400 ppm |
| 1.00 | 2700 ppm |
| 1.11 | 869 ppm |
| 1.20 | 318 ppm |
| 1.33 | 66 ppm |
| 1.40 | 27 ppm |
| 1.50 | 6.8 ppm |
| 1.60 | 1.59 ppm |
| 1.67 | 0.55 ppm |
| 1.80 | 0.0667 ppm |
| 2.00 | 0.002 ppm |